
I help businesses and managers turn raw data into structured MIS reports and interactive dashboards using Excel, Power BI, and AI tools.
My focus is on identifying key numbers that highlight business performance, risks, and growth opportunities — enabling faster and smarter decision-making.
I use Advanced Excel, Power Query, and Power BI to clean data, automate reporting, and build dynamic dashboards that reduce manual work and improve accuracy.
By leveraging AI tools like ChatGPT, I speed up analysis, improve logic building, and deliver insights more efficiently — helping organizations save time and take action faster.
Core Skills & Tools
• Advanced Excel (Formulas, Functions, Data Modelling, Automation)
• Power Query (Data Cleaning, Transformation & Automation)
• Pivot Tables & MIS Reporting
• Excel Dashboards & KPI Tracking
• Power BI Desktop (Data Modelling & Interactive Reports)
AI-Assisted Analytics:
• ChatGPT (logic building, insights generation, automation ideas)
• Google AI Studio (analysis workflows & efficiency improvement)
My goal is to convert raw data into accurate, automated, and insight-driven MIS reports that support real business decisions — not just visuals.
Industry-recognized certifications supporting my expertise in Excel and Power BI.


A structured MIS-focused approach to transform raw business data into accurate reports, dashboards, and actionable insights.
• Data Understanding – Understanding business requirements, data sources, and reporting needs
• Data Cleaning & Preparation – Using Excel & Power Query to clean, structure, and validate data for accuracy
• KPI & Report Planning – Defining key metrics and designing MIS reports aligned with business goals
• Dashboard Development – Building interactive dashboards in Excel & Power BI for performance tracking
• Automation Setup – Automating reports to reduce manual work and ensure timely updates
• Data Analysis – Identifying trends, patterns, and performance gaps in business data
• Insight Generation – Converting data into clear insights, risks, and growth opportunities
• Business Decision Support – Presenting insights in a way that supports faster and smarter decision-making
• Final Delivery – Delivering clean, easy-to-use reports and dashboards with proper explanation
• AI Integration – Using AI tools to speed up analysis, improve efficiency, and generate smarter insights
Real-world MIS dashboards built using Excel, Power BI, and AI-assisted tools to accelerate data analysis, automate reporting, and deliver accurate, decision-ready insights faster.
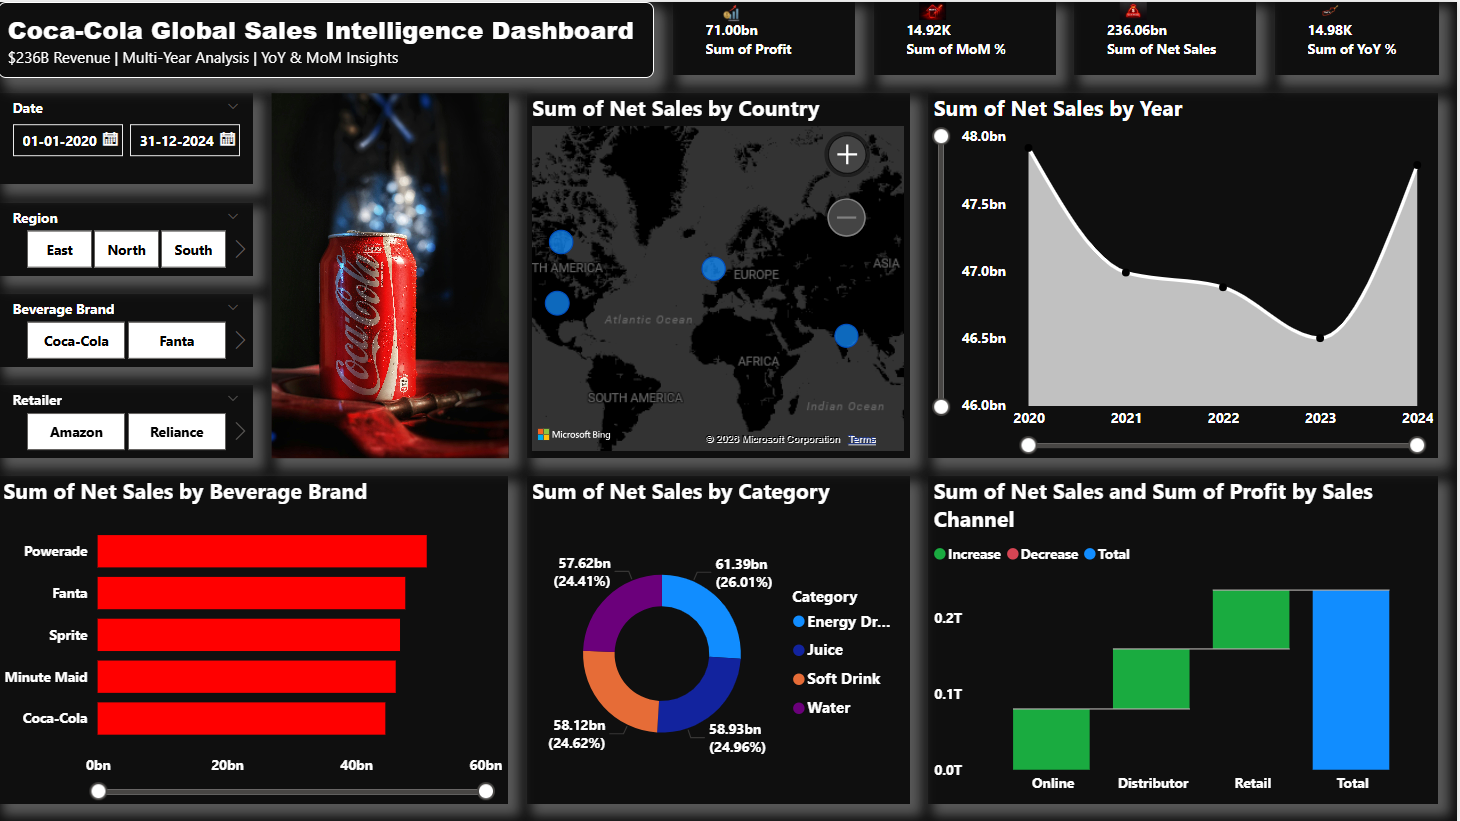
An advanced Power BI dashboard designed to analyze $236B+ global sales data across multiple years, delivering deep insights into revenue performance, brand trends, geographic distribution, and channel efficiency.
This dashboard enables stakeholders to identify growth opportunities, market shifts, and performance gaps using interactive visuals and real-time filtering.
It transforms raw data into actionable business intelligence, supporting faster and smarter decision-making at scale.
Tools Used:Power BI | Data Modeling | DAX | Power Query | Excel | Data Visualization
Key Focus: Revenue Analysis | Profitability Tracking | YoY & MoM Growth | Brand Performance | Regional Insights | Channel Optimization
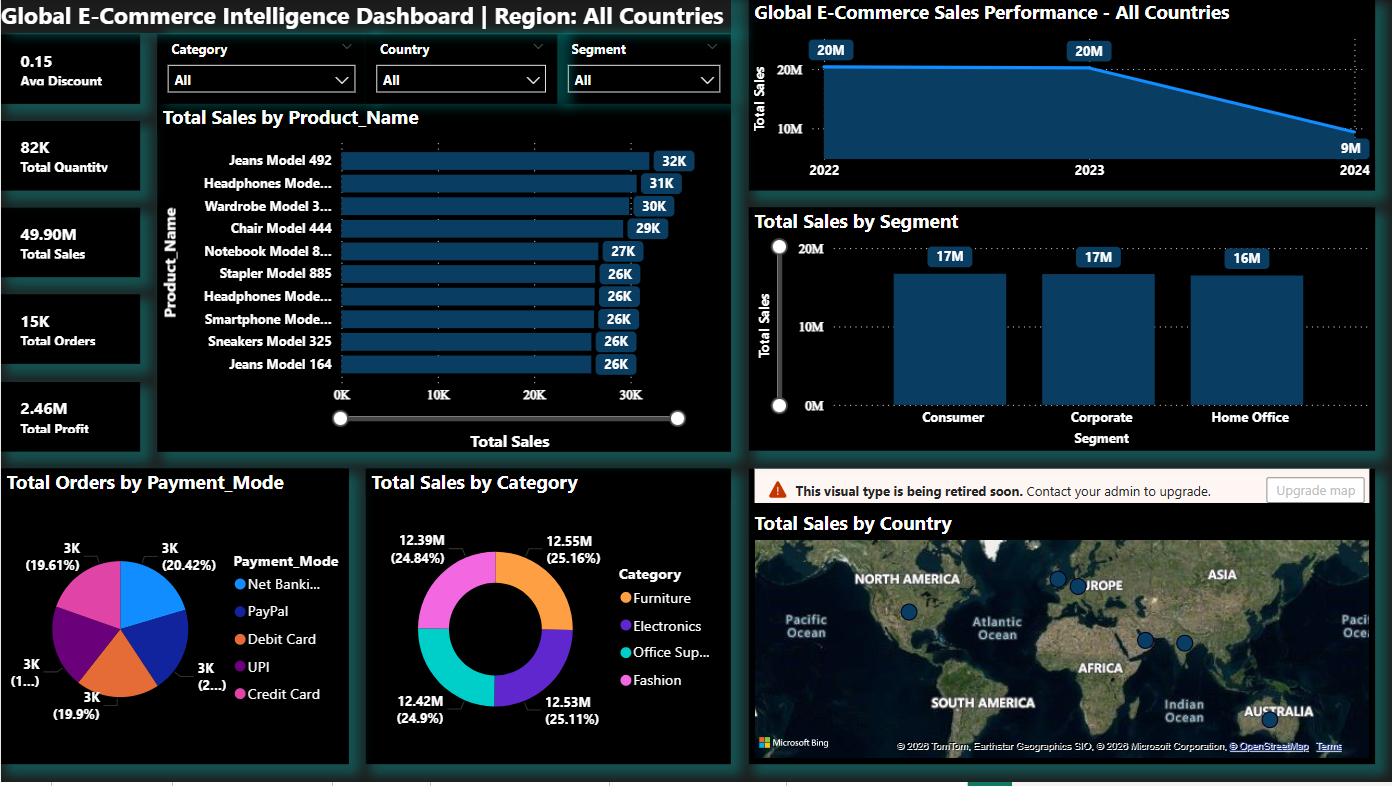
An interactive MIS dashboard built using Power BI to track sales, profit, orders, and customer segments across regions and categories.
This dashboard helps identify top-performing products, regional performance gaps, and key trends — enabling faster, accurate, and data-driven business decisions.
AI-assisted insights and logic building were used to speed up analysis and improve reporting efficiency.
Tools Used: Power BI | Data Modeling | DAX | AI Tools
Key Focus: Sales Analysis | KPI Tracking | Regional Performance | Business Insights
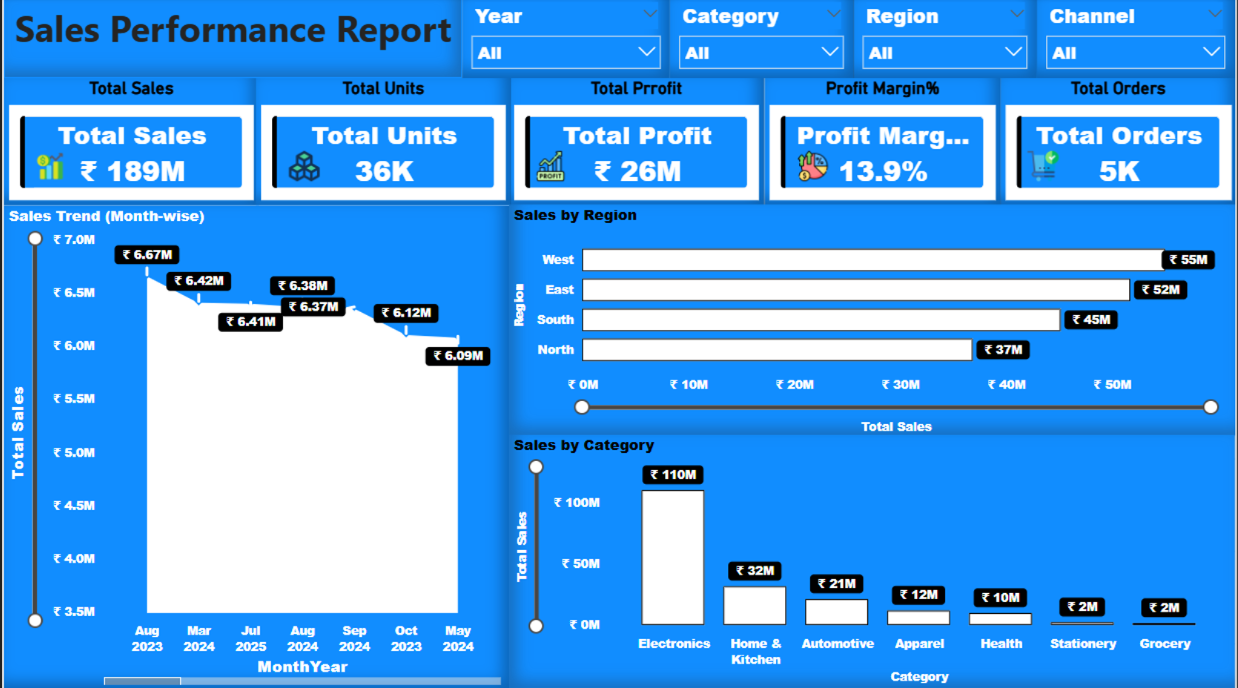
An interactive Power BI dashboard designed to track sales performance, revenue, profit, and orders across regions, categories, and time periods.
The dashboard enables users to analyze trends, compare performance, and identify key business insights for faster and data-driven decision-making.
AI-assisted analysis and logic building were used to speed up data processing, improve insights, and reduce manual effort in reporting.
Tools Used: Power BI | Data Modeling | DAX | AI Tools
Key Focus: Sales Analysis | KPI Tracking | Trend Analysis | Regional Performance
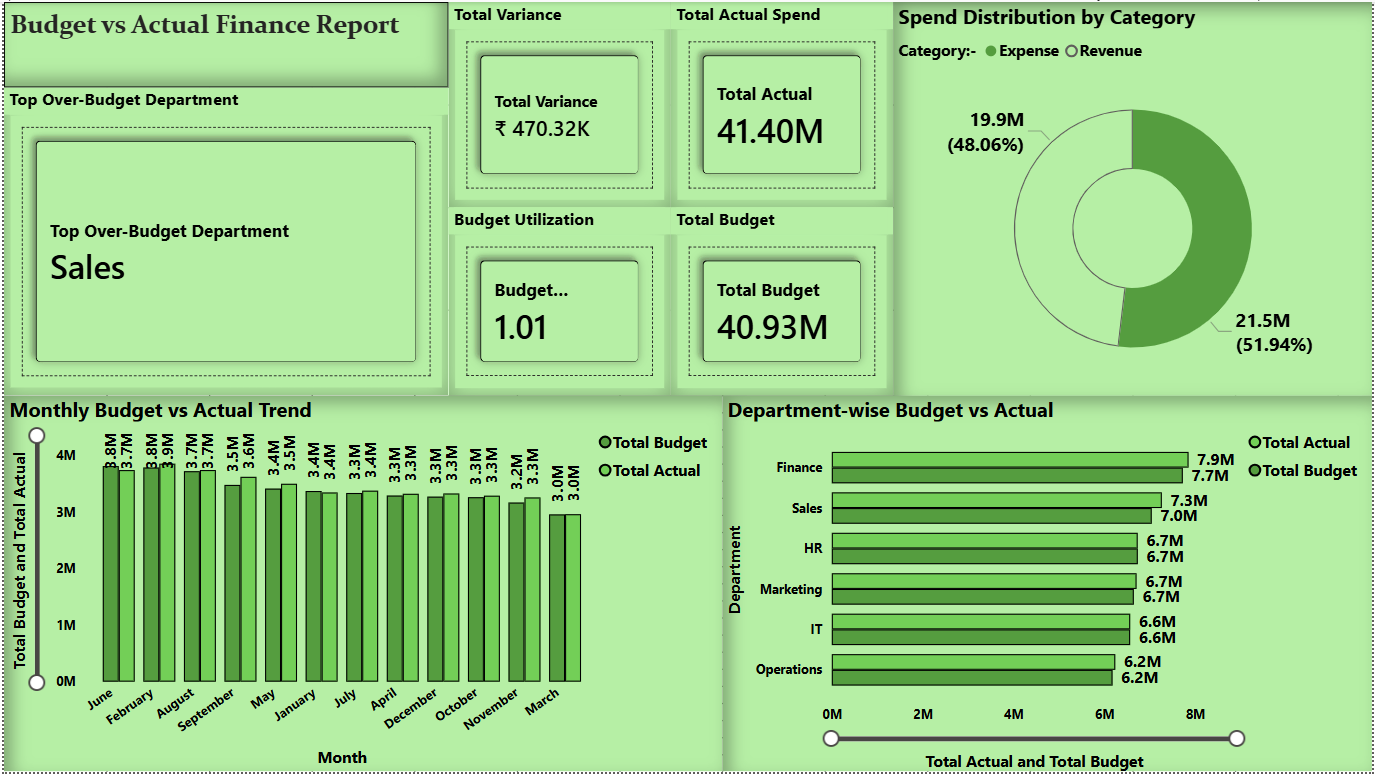
An interactive Power BI dashboard designed to compare budget vs actual performance across departments, tracking spending, variances, and budget utilization.
The dashboard helps identify overspending areas, control costs, and support better financial planning through clear and data-driven insights.
AI-assisted analysis was used to speed up variance identification, highlight cost patterns, and improve reporting efficiency.
Tools Used: Power BI | Data Modeling | DAX | AI Tools
Key Focus: Budget Analysis | Variance Tracking | Cost Control | Financial Insights
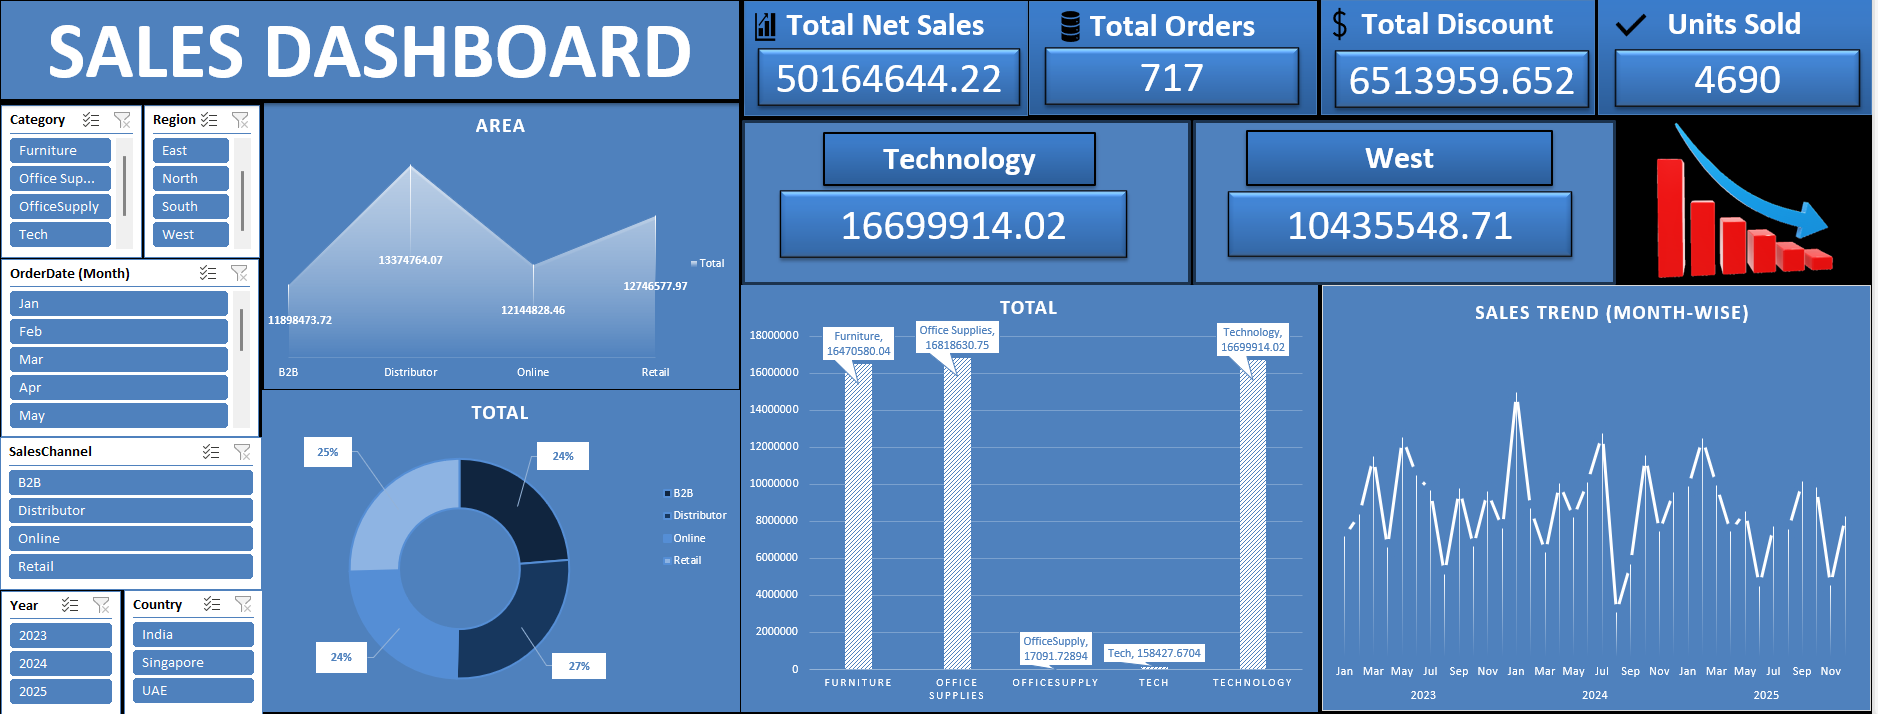
An interactive Excel dashboard designed to track sales performance, revenue, orders, discounts, and units sold across regions and product categories.
The dashboard enables dynamic filtering, trend analysis, and KPI tracking to support faster and more accurate business decision-making.
AI-assisted logic building and analysis were used to speed up report creation, improve formulas, and enhance overall reporting efficiency.
Tools Used: Advanced Excel | Pivot Tables | Charts | Data Analysis | AI Tools
Key Focus: Sales Analysis | KPI Tracking | Trend Analysis | Performance Monitoring
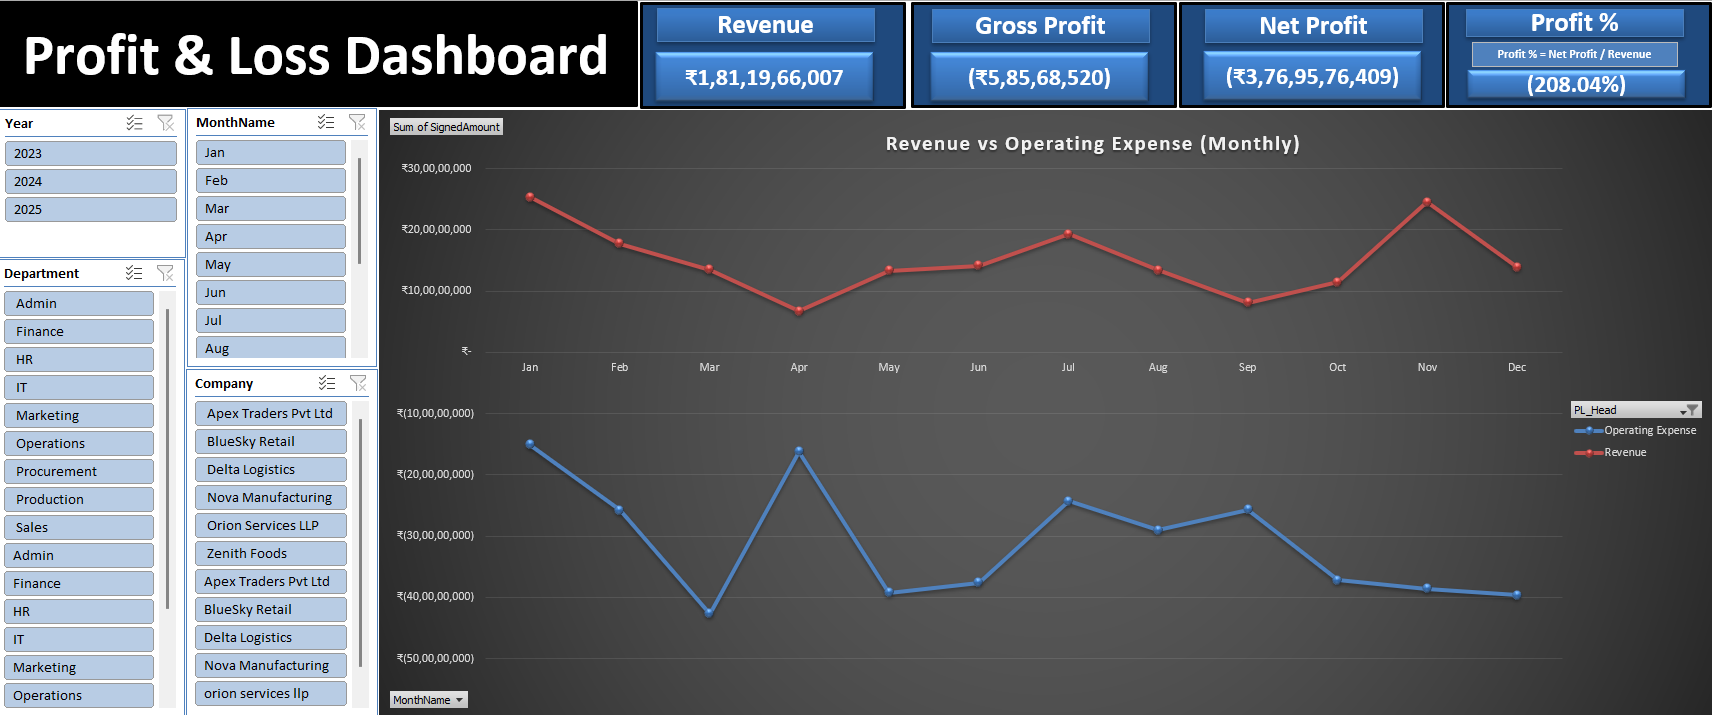
An interactive Excel-based Profit & Loss dashboard designed to track revenue, expenses, gross profit, net profit, and monthly financial trends.
The dashboard helps analyze cost structures, monitor profitability, and support better financial decision-making and cost optimization.
AI-assisted logic building and analysis were used to speed up calculations, improve accuracy, and enhance financial reporting efficiency.
Tools Used: Advanced Excel | Formulas | Pivot Tables | Charts | Financial Analysis | AI Tools
Key Focus: Profitability Analysis | Cost Control | Revenue vs Expense Tracking | Financial Insights
• Identified underperforming regions through dashboard analysis and improved sales strategy
• Reduced inventory risks by analyzing stock trends and optimizing reorder planning
• Improved cost control using budget vs actual variance insights for better financial decisions
Turning raw data into clear, actionable business insights that drive faster and smarter decision-making.
Each dashboard is designed not just to show data, but to highlight key patterns, risks, and opportunities—helping management take confident, data-driven actions.
1. Global Revenue Performance
Insight:
Total net sales exceeded $236B, showing strong overall business performance with steady multi-year growth.
Decision:
Focus on sustaining growth by strengthening high-performing markets and scaling profitable channels.
—
2. Yearly Sales Trend Analysis
Insight:
Sales declined in 2023 (~-2.5%) but recovered in 2024 (~+3.2%), indicating a temporary market slowdown followed by rebound.
Decision:
Analyze the root cause of the 2023 dip (supply chain, pricing, demand) to prevent future performance drops.
—
3. Regional Revenue Contribution
Insight:
North America and Europe contribute over 60% of total revenue, making them dominant markets.
Decision:
Increase investments in these regions while expanding into emerging markets for diversification.
—
4. Brand Performance Analysis
Insight:
Powerade and Fanta outperform Coca-Cola in total sales, indicating a shift in consumer preferences.
Decision:
Boost marketing and distribution for high-performing brands and reposition underperforming products.
—
5. Sales Channel Performance
Insight:
Online channel contributes the highest revenue (~35%), outperforming Retail and Distributor channels.
Decision:
Expand digital sales infrastructure and optimize e-commerce strategies for scalability.
—
6. Product Category Distribution
Insight:
Revenue is evenly distributed across categories (~24–26%), reducing dependency on a single segment.
Decision:
Maintain a balanced product portfolio while identifying opportunities for category-level growth.
—
7. Growth Trend (YoY & MoM)
Insight:
Consistent Month-over-Month growth and positive Year-over-Year performance indicate stable business expansion.
Decision:
Leverage growth trends to plan long-term strategies and forecast future demand effectively.
—
8. Profitability Insights
Insight:
High total profit (~$71B) reflects strong operational efficiency and pricing strategy.
Decision:
Continue optimizing cost structures and pricing models to maximize profitability.
—
1. Category Performance
Insight:
Electronics category generates the highest revenue compared to other product categories.
Decision:
Increase inventory and marketing investment in high-performing categories to maximize growth.
2. Regional Sales Distribution
Insight:
Sales are concentrated in a few key regions while some regions show underperformance.
Decision:
Expand targeted marketing and distribution strategies in underperforming regions.
3. Customer Segment Contribution
Insight:
The Consumer segment contributes the largest share of total sales.
Decision:
Strengthen customer engagement and loyalty programs for high-value segments.
4. Product Performance
Insight:
A small group of top products drives a major portion of total sales.
Decision:
Focus on promoting high-performing products and optimize product portfolio.
5. Profit vs Discount
Insight:
Higher discount levels reduce overall profitability.
Decision:
Implement controlled discount strategies to protect profit margins.
6. Shipping Cost Impact
Insight:
Shipping costs significantly affect overall profitability.
Decision:
Optimize logistics and negotiate better shipping contracts.
1. Overall Revenue Performance
Insight:
The business is generating strong overall revenue, reaching ₹189M, indicating solid market demand.
Decision:
Increase strategic investment in high-performing products and regions to accelerate growth.
2. Profitability Analysis
Insight:
With a total profit of ₹26M and ~14% profit margin, the company maintains healthy profitability.
Decision:
Prioritize high-margin categories to further improve overall profit performance.
3. Regional Performance
Insight:
The West region leads in revenue contribution, while the North region underperforms.
Decision:
Run targeted marketing campaigns and expand distribution in underperforming regions.
4. Category Contribution
Insight:
The Electronics category dominates total sales, while other categories contribute less.
Decision:
Ensure availability of top-performing products and optimize promotions for low-performing categories.
5. Sales Trend Analysis
Insight:
Recent monthly trends show a gradual decline in sales performance.
Decision:
Introduce seasonal campaigns, promotional offers, and demand-generation strategies to boost sales.
6. Order & Units Analysis
Insight:
A high ratio of units sold (36K) compared to total orders (5K) indicates strong average order value.
Decision:
Leverage bundle pricing and bulk purchase incentives to maintain higher order value.
7. Margin Optimization
Insight:
While overall margins are stable, some categories face margin pressure due to pricing or cost factors.
Decision:
Perform category-level cost and discount analysis to improve margin efficiency.
8. Channel Performance
Insight:
Sales vary significantly across different channels, indicating uneven contribution.
Decision:
Allocate higher budget and focus on high-performing sales channels to maximize ROI.
1. Budget Utilization Overview
Insight:
Overall spending is close to the allocated budget, but slightly exceeding it (utilization above 100%).
Decision:
Implement tighter expense monitoring and control mechanisms for the upcoming periods.
2. Department-Level Overspending
Insight:
The Sales department is exceeding its allocated budget significantly.
Decision:
Introduce ROI tracking and campaign performance evaluation to justify and optimize sales spending.
3. Controlled Department Spending
Insight:
Finance and IT departments are maintaining spending within budget limits.
Decision:
Replicate effective cost management practices from these departments across the organization.
4. Monthly Spending Trend
Insight:
Monthly spending remains stable without major fluctuations or spikes.
Decision:
Continue the current budgeting approach with minor adjustments at the department level.
5. Expense vs Revenue Distribution
Insight:
Spending across expense and revenue categories is relatively balanced.
Decision:
Identify cost optimization opportunities within expense-heavy categories.
6. Variance Analysis
Insight:
Overall variance is on the positive side, indicating overspending.
Decision:
Identify high-variance months and implement pre-approval mechanisms for large expenses.
7. Budget Utilization Risk
Insight:
Budget utilization is exceeding 100%, indicating potential financial risk.
Decision:
Consider mid-year budget revision or introduce contingency funds.
8. Overspending Concentration
Insight:
Overspending is concentrated in specific departments rather than across the organization.
Decision:
Apply targeted cost control strategies instead of organization-wide budget cuts.
1. Top Selling Category
Insight:
Technology category drives the highest net sales performance.
Decision:
Increase investment in high-performing categories through inventory expansion and targeted marketing.
2. Regional Performance
Insight:
West region leads overall sales contribution.
Decision:
Strengthen presence in top-performing regions while improving weaker ones.
3. Sales Trend Analysis
Insight:
Monthly sales trends show fluctuations with identifiable peak periods.
Decision:
Align marketing campaigns and inventory planning with peak demand periods.
4. Channel Performance
Insight:
Revenue is generated through multiple channels including B2B, Retail, Online, and Distributor.
Decision:
Optimize channel strategy by focusing on high-performing segments.
5. Interactive Dashboard Capability
Insight:
Dynamic filters enable real-time analysis across multiple dimensions.
Decision:
Leverage real-time insights for faster and more accurate business decisions.
1. Net Profit Performance
Insight:
Net profit remains negative despite strong revenue, indicating high operational or cost pressure.
Decision:
Review operating expenses and identify high-cost areas to improve overall profitability.
2. Revenue vs Expense Trend
Insight:
Revenue growth is not proportional to operating expenses, leading to margin compression.
Decision:
Implement strict cost control during high-expense periods and optimize expense allocation.
3. Gross Margin Pressure
Insight:
Gross profit remains relatively low compared to revenue, suggesting a high cost of goods sold.
Decision:
Optimize procurement pricing, renegotiate vendor contracts, and improve product mix.
4. Department-wise Cost Analysis
Insight:
Cost distribution varies significantly across departments, highlighting cost-heavy areas.
Decision:
Introduce department-level budgets and accountability to control excessive spending.
5. Interactive Financial Analysis
Insight:
The dashboard enables dynamic analysis across year, month, department, and company.
Decision:
Use real-time financial insights to support faster and more accurate business decisions.
✅ These dashboards are built to replicate real business use-cases, showcasing how data-driven and AI-assisted insights can help organisations improve performance, optimise costs, and make confident strategic decisions.
